Software update: MaxSea TimeZero ECS & PLOT v2

We are pleased to announce the release of MaxSea TimeZero ECS/PLOT version 2. This update includes many new features and enhancements over the previous version and is free for existing TimeZero ECS/PLOT v1.x users.

Here is a short overview of the major new features:

Discrete Depth Shading
The Depth Shading can be set to a user defined discrete color palette. This allows specific depths to be highlighted with specific colors:

MaxSea TimeZero pro new features: depth shading

Sounder
Compatibility with Furuno Ethernet Sounders has been further improved. MaxSea TimeZero can now display the Sounder Echogram in Dual Frequency and has access to the Bottom Lock and Bottom Zoom feature of the Sounder:

Better integration with with Furuno Ethernet Sounders

Bottom Discrimination with Furuno BBDS1
Paired with MaxSea TimeZero PLOT, the BBDS1 is the most affordable solution on the market to collect depth and bottom discrimination information:

BBDS1: best tool for bottom discriminationMaxSea TimeZero ECS/PLOT includes many other features, please find full details of this release in this document: MaxSea TimeZero ECS/PLOT V2

If you want to know more about our professional range, here are MaxSea TimeZero ECS and MaxSea TimeZero Plot product pages.

Wide Charts vs. MegaWide Navigation Charts, what’s the difference?

Wide and MegaWide are terms commonly used by cartographic data providers to describe the size of navigation charts. MapMedia, MaxSea’s subsidiary specialized in digital cartography and Raster data treatment, also employs this terminology to better classify its charts offer in both mm2 (for MaxSea v12 and previous software) and mm3d (for TIMEZERO software) formats.

Wide and MegaWide area size vary according to its geographical coverage and the number of navigation charts included within each area.

Wide areas are approximately 3 times smaller than MegaWide areas at some locations.

Let’s take the Mediterranean Raster charts as an example:

WRMEM32MAP6.1 Mediterranean Sea – West

WRMEM32MAP6.1

This Wide area includes all the navigation charts available from Gibraltar to the west coast of Italy.

MWRMEM23MAP6.1 Mediterranean Sea

MWRMEM23MAP6.1

This MegaWide area includes all the Mediterranean Sea charts available.

In comparison, here’s the old area coverage of mm2 charts which were compatible with MaxSea v12 and previous versions:

Mediterranean MapMedia mm2 Navigation Charts

It takes almost 6 old mm2 charts to make the latest mm3d Wide chart.

The West Mediterranean Sea Wide area contains around 575 charts and maps whereas the MegaWide (covering the whole Mediterranean Sea) contains more than 1700 navigation charts and maps.

The level of detail is the same for both sizes as every area includes:

  • Route maps
  • Landing maps
  • Coastal maps
  • Detailed maps and all ports available

5 Tips for Choosing the Best Nautical ChartAll navigation charts are updated at least once a year. For Raster charts, MapMedia orders all available charts from each local Hydrographic Service every year in order to scan them and convert them to its unique mm3d format. For Vector charts, MapMedia retrieves the cartographic data from its providers (currently Jeppesen and Navionics) and converts it to mm3d as well.

Related topics:

What’s the difference between Raster and Vector charts?

5 Tips for choosing the best nautical chart Free Guide


Central America and the Caribbean Raster Charts Update

The following Raster charts have been updated and are available as of January 10th, 2013 on our Chart Catalogue:

Raster Chart Update - January 2013

These updates include the latest charts and NTM provided by our data providers.

Here are some examples of the improvements introduced to MapMedia Raster charts:

Old/New Caribbean Chart

Old/New Caribbean - MapMedia Raster chart
Old/New Caribbean – MapMedia Raster chart (WRMNA908MAP3.1)

Old/New Central America Chart

Central America - MapMedia Raster chart
Central America – MapMedia Raster chart (WRMNA912MAP3.1)

You can see more examples of this charts update release in our Facebook album or Google+ Photos section.

2012 in review

In 2012, we’ve launched 2 new software version, both for sailing (v1.9.7 and v1.9.8) and professional (v1.2 and v1.2.1) ranges, and redesigned our website.

Our “How to use MaxSea on iPad” post met a huge success among our users (although a MaxSea App is not very far…) but it was our Concordia Shipwreck coverage who stole the show with French newspaper Le Figaro and British BBC News contacting us to get MaxSea TimeZero screenshots at the shipwreck site.

Costa Concordia Media Coverage
BBC and Le Figaro media coverage with MaxSea TimeZero screenshots

This year, MaxSea International has proudly supported many skilled sailors, races, projects and navigation-related personalities either as sponsor or as technical supplier, confirming its major role in marine navigation equipment:

Michel Desjoyaux and its Mer Agitée Team

François Gabart, currently participating in the Vendée Globe race

Samantha Davies

Isabelle Joschke

The Vendée Globe 2012-2013

La Solidaire du Chocolat

Europa Warm’Up

Krys Ocean Race

Sailing Arabia – The Tour

Normandy Sailing Week

Normandy Channel Race

Jacques Vapillon

Frédéric Jouve

Team Jolokia

Jean-Baptiste L’Ollivier

Gilles Chiorri

and many more…

The 2012 Nautic Paris Boat Show (Salon Nautique International de Paris) was our must successful event of the year with more than 1000 in-person product demos and the wonderful opportunity to meet and share with our users and enthousiasts.

MaxSea Team at the 2012 Nautic
MaxSea Team at the 2012 Nautic Boat Show

In 2013 we’ll keep you informed about our products, company and many topics in the navigation world. Remember to subscribe to our Newsletter if you want news, special offers & deals and great content!

Free Guide: 10-point safety checklist before sailing

Navionics, pioneer in marine navigation data and electronic charts

Through MapMedia, MaxSea TimeZero Navigator ensures the most complete offer in vector charts thanks to privileged agreements with the best electronic chart data providers such as Navionics.

Geonav by Navionics, the first electronic chart device

Pioneer in GPS systems, Navionics launched the very first electronic chart device in the world in 1984, called the Geonav. It quickly became one of the leader in marine cartography, electronic charting and navigation data. Its constant quest for technological innovations has turned Navionics into a reference for data quality and wide electronic chart coverage, very appreciated by sailors and marine professionals all over the world.

Navionics electronic charts can seamlessly cover large areas and allow to zoom down to a resolution of 1 meter (3ft), featuring:

• Tides & Currents
• Port plans
• User-selectable safety depth contour
• Marine services with phone numbers
• Navigation aids with XPlain
• Marsh areas

Navionics provides very comprehensive and frequently updated salt waters, lakes, rivers and marine data, and has achieved remarkable improvements in its latest releases.

Navionics Mega Wide charts now available

Navionics expands its electronic chart offer with the release of several Mega Wide charts:

Africa & Middle East MWVNAF30XGMAP5.1

Africa and Middle East Navionics Electronic chart
NEW Africa and Middle East Navionics vector mega wide chart (MWVNAF30XGMAP5.1)

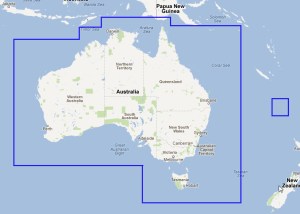
Australia MWVNAU32XGMAP5.1

Australia Navionics electronic chart
NEW Australia Navionics vector mega wide chart (MWVNAU32XGMAP5.1)

South China Sea, Korea, Japan MWVNAS35XGMAP5.1

South China Sea, Korea, Japan Navionics electronic chart
NEW South China Sea, Korea, Japan Navionics vector chart (MWVNAS35XGMAP5.1)

Enhanced quality of marine data

Navionics has collected a wide range of marine depth data through echo soundings in various areas, which profoundly increased the quality of its marine cartography.

See 2 screenshots of the Bahamas area from Navionics and another electronic chart data provider:

Electronic charts comparison
Bahamas ocean depth data comparison

Addition of positive values ​​on foreshores

United Kingdom, Ireland and Holland WV28XGMAP1.3

United Kingdom and Ireland Navionics Electronic chart
Old and New United Kingdom and Ireland Navionics Vector Charts

Improved area junctions

Umanai – Greenland – WVNEN21MAP5.1

Umanai - Greenland - Navionics electronic chart
Old/New Umanai – Greenland – Navionics vector chart (WVNEN21MAP5.1)

See all Navionics electronic charts (in vector format) latest releases:

August – United Kingdom, Ireland, Holland & Hamburg Navionics Vector Charts Update

September – Oceania, Europe and Africa Navionics Vector Charts Update

October – Scandinavia, Iceland, Greenland and East Asia Navionics Vector Charts Update

November – Asia, Africa and America Navionics Vector Charts Update

Find all these charts in MaxSea TimeZero charts catalogue.

Alternative Routing for the Vendée Globe starting

The 2012 Vendée Globe Race starts today and racers are already counting on their marine navigation software to find the best possible route according to weather forecasts and some other important factors.

We’ve launched our Routing Module in order to see what’s the best option at the start of the race and this is what we’ve obtained:

Route 1 - Vendée Globe Race

In the image, we can see that at 10am on the 12th, there will be poor wind, which is bad news for the 20 skippers…so we’ve decided to relaunch it using the Alternative Routing feature to see if there could be another more accurate route surrounding that area:

Alternative route feature launch - Vendée Globe Race

Route 2 - Vendée Globe Race

What we’ve got, is a route that goes further in the Ocean, avoiding the Spanish Coast as compared to the previous one:

Route 1 vs Route 2 - Vendée Globe Race

Here’s a reenactment of this second alternative route for the Vendée Globe racers:

We’ll see which one is taken by the skilled sailors…Good winds for all of them!

Asia, Africa and America Navionics Vector Charts Update

The following Navionics Vector charts have been updated and are available as of November 9th, 2012 on our Chart Catalogue:

Navionics Chart Update - November 2012

Please note that a minor bug was fixed for the NOAA chart and that the WORLDVNMAP5.1 Navionics World Pack is also ready for download.

These updates include the latest charts and NTM provided by our data providers.

Here are some examples of the improvements introduced to Navionics vector charts:

Old/New Philippines to Java Chart

Old/New Philippines to Java - Navionics vector chart
Old/New Philippines to Java – Navionics vector chart (WVNAS68MAP5.1)

Old/New Indian Ocean Chart

Old/New Indian Ocean - Navionics vector chart
Old/New Indian Ocean – Navionics vector chart (WVNIN73MAP5.1)

New Upper Volga River Chart

NEW Upper Volga River Navionics Vector Chart
NEW Upper Volga River Navionics Vector Chart (MWVNRS37XGMAP5.1)

New Pacific Islands & Japan Charts

NEW Pacific Islands & Japan Navionics Vector Chart
NEW Pacific Islands & Japan Navionics Vector Chart (MWVNPC34XGMAP5.1)

You can see more examples of this charts update release in our Facebook album or Google+ Photos section.

Scandinavia, Iceland, Greenland and East Asia Navionics Vector Charts Update

The following Navionics Vector charts have been updated and are available as of October 10th, 2012 on our Chart Catalogue:

Scandinavia, Iceland, Greenland and East Asia Navionics Chart Update - October 2012

These updates include the latest charts and NTM provided by our data providers.

Here are some examples of the improvements introduced to Navionics vector charts: Old/New Aland Sea – Sweden East Chart

Old/New Aland Sea - Sweden East - Navionics vector chart
Old/New Aland Sea – Sweden East – Navionics vector chart (WVNEN13MAP5.1)

Old/New Umanai – Greenland Chart

Old/New Umanai - Greenland - Navionics vector chart
Old/New Umanai – Greenland – Navionics vector chart (WVNEN21MAP5.1)

New Greenland & Iceland Chart

NEW Greenland & Iceland Navionics vector chart
NEW Greenland & Iceland Navionics vector chart (MWVNEN20XGMAP5.1)

New South China Sea, Korea, Japan Chart

NEW South China Sea, Korea, Japan Navionics vector chart
NEW South China Sea, Korea, Japan Navionics vector chart (MWVNAS35XGMAP5.1)

New Scandinavia East Chart

NEW Scandinavia East Navionics vector chart
NEW Scandinavia East Navionics vector chart (MWVNEN44XGMAP5.1)

You can see more examples of this charts update release in our Facebook album or Google+ Photos section.

The importance of oceanographic data for fishing

Sea surface currents, temperature, chlorophyll concentration and altimetry provide essential data for efficient and productive fishing and a better understanding of the behavior of fish (pelagic fish in particular) and better target fishing zones.

Sea Surface Temperature

MaxSea TimeZero Plot - Sea surface temperature

MaxSea TimeZero Plot offers an accurate, detailed display of the surface temperature, obtained via satellite. Each new version of MaxSea offers data that is increasingly global and more and more accurate.
The most important point is to clearly identify “rupture zones”, or in other words, thermal fronts where masses of water of different temperatures converge (in this image, a red zone, which is hotter, is encountering a yellow zone, which is colder). Fronts are likely to shelter more bait fish and therefore fish (mainly pelagic fish).

MaxSea TimeZero allows the selective display of a specific range of sea surface temperature, when targeting specific conditions.

Altimetry

MaxSea TimeZero Plot - Altimetry

Altimetry is an anomaly in the surface water height, in relation to a referenced mean sea surface height. These surface height measurements indicate the below surface temperature of water columns which change less quickly than the surface temperature.

The warmer the water is, the more the anomaly will be “positive” (higher than the referenced mean surface height) and vice versa.

The altimetry is obtained by radar detection. Unlike the surface temperature, sensing it is not susceptible to the presence of clouds. It therefore provides efficient information supplemental to the surface temperature. Here too, the zones where masses of warm water and cold water converge are the most interesting.

Thanks to MaxSea it is easy to use graphical display, it is easy to determine potentially fruitful fishing zones.

The fronts between warm and cold zones (between positive and negative anomalies) are zones where pelagic fish and particularly tuna are more likely to be present.

Surface current

MaxSea TimeZero Plot - Ocean currents

Indicating rising water and therefore rising nutrients and phytoplankton. Cold eddies are zones where pelagic fish are likely to find their food. Surface currents and eddy zones offer highly complementary, useful data, completely free of charge and on a flexible basis via the MaxSea Chopper interface (choice of zone, size of the zone, etc.).

Chlorophyll Concentration

MaxSea TimeZero Plot - Chlorophyll Concentration

Chlorophyll concentration is a measure of the abundance of algae, also called phytoplankton, which account for most of the plant production in the ocean. Phytoplankton is difficult to measure directly, yet they are the direct or indirect source of food for most marine animals. MaxSea Chopper interface allows you to consult Data of Chlorophyll Concentration indicated in mg/m3.

With MaxSea TimeZero Plot, enjoy the benefit of free and accurate oceanographic data in order to identify your potential fishing zones, save fuel, time and operating costs, and achieve higher performance.

Important Navionics Vector Charts Update: Oceania, Europe and Africa

The following Navionics Vector charts have been updated and are available as of September 17th, 2012 on our Chart Catalogue:

Navionics Vector Charts Update - September 2012

These updates include the latest charts and NTM provided by our data providers.

Here are some examples of the improvements introduced to Navionics vector charts by zone:

Australia

Australia - East Navionics vector chart update
Old/New Australia – East Navionics vector chart « including The Great Barrier Reef Marine Park Authority data (GBRMPA) (WVNAU62MAP5.1)
NEW Australia Navionics vector chart
NEW Australia Navionics vector mega wide chart (MWVNAU32XGMAP5.1)

Mediterranean/Europe Inland

Old/New Mediterranean Sea - West Navionics vector chart
Old/New Mediterranean Sea – West Navionics vector chart (WVNEM32MAP5.1)
Mediterranean & Black Sea Navionics vector chart update (MWVNEM43XGMAP5.1)

Africa

Old/New Red Sea - Arabian Gulf Navionics vector chart
Old/New Red Sea – Arabian Gulf Navionics vector chart (WVNME43MAP5.1)
NEW Africa & Middle East Navionics vector chart
NEW Africa & Middle East Navionics vector mega wide chart (MWVNAF30XGMAP5.1)

West Europe/Denmark

Denmark, Germany, Skagerrak, Sweden West Navionics vector chart update
Old/New Denmark, Germany, Skagerrak, Sweden West Navionics vector chart (WVNEN15MAP5.1)
West Europe Navionics vector chart update
West Europe Navionics vector chart update (MWVNEW46XGMAP5.1)

You can see more examples of these charts update release in our Facebook album or Google+ Photos section.