
Hydrographic charts are an essential source of data for MaxSea marine charts in order to guarantee the quality of this basic onboard tool for safe sailing while at sea.
Did you ever wonder how MapMedia marine charts are produced? Although the charts are edited by MapMedia, this company uses hydrographic charts collected and then updated by hydrographic offices all around the world. Here, we explain the steps of this process.
To draw up a chart, first we must compile data, edit it and then keep it continuously updated.
The data collection
The hydrographic office first acquires bathymetric, topographic and sedimentological surveys as well as satellite imagery and any additional data needed.
Production of the chart
Once all this data has been compiled and verified, a paper chart is drawn up, following very precise specifications in order to comply with sailing requirements in each specific area. All the necessary information for sailing and safety are provided on the paper chart. The chart must be both precise and easy to read so that you can sail safely.
This first date of publication is always included on the hydrographic chart. We have included images from the French Hydrographic Office to to explain each point in this post.
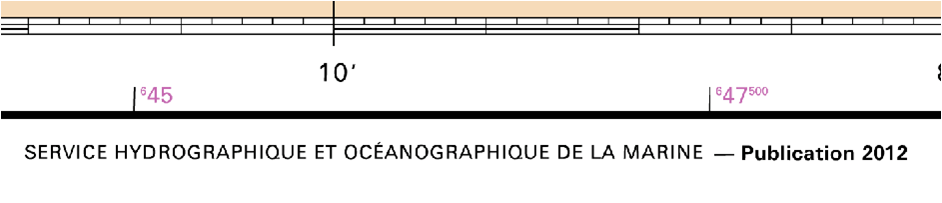

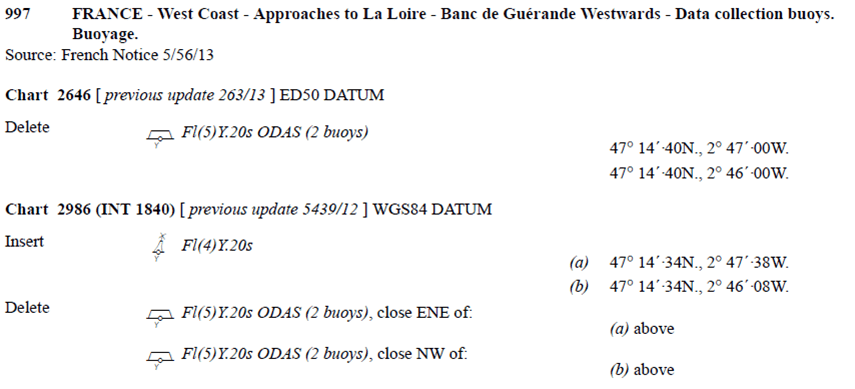
Chart Updates
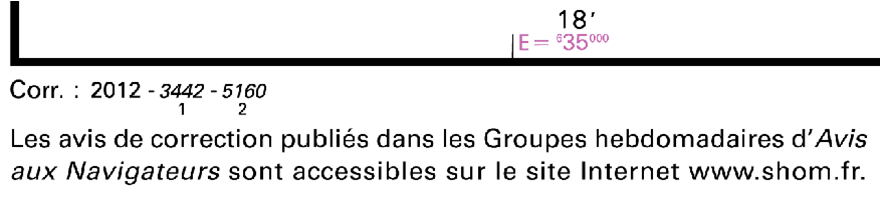
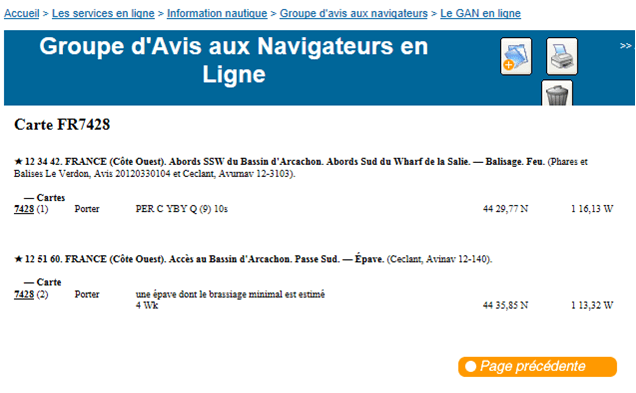
Every week, minor or major corrections are reported on the hydrographic chart and then released via the « Groupe d’Avis aux Navigateurs GAN » or “Notice to Mariners – NTM”.
–
![]()
–
–
–
In the case of minor corrections that are not essential for sailor safety, the marine chart is printed again. The date of this new print is mentioned on the chart. A chart can also be printed again if out of stock. The date of the reprint is mentioned on the chart.
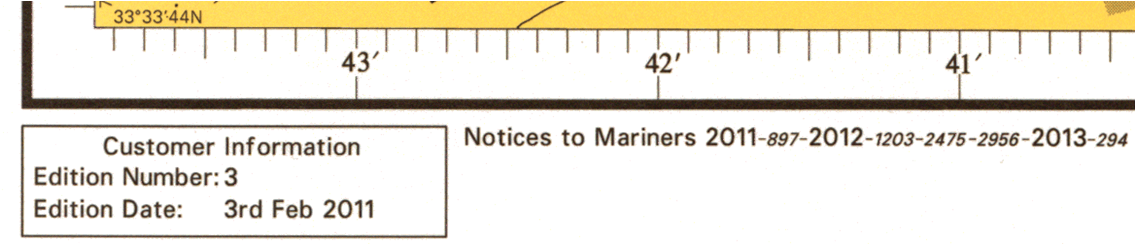
When major modifications occur, the hydrographic chart is reprinted. A new publication number and date are added to the chart:

–

New chart SHOM N° 7428

MapMedia compares marine charts and different catalogues and selects the best chart for a specific location in order to provide the most reliable information for safe sailing.
—————–
Don’t forget to download this useful guide on how to choose the right marine chart for you:

Looking for specific instructions to make electronic chart corrections to our Max Sea charts?
Hello Stephen,
Thank you for your message. Please fill out this form so we can take into account your corrections: https://www.maxsea.com/support/anomaly_report
Best regards,
MaxSea